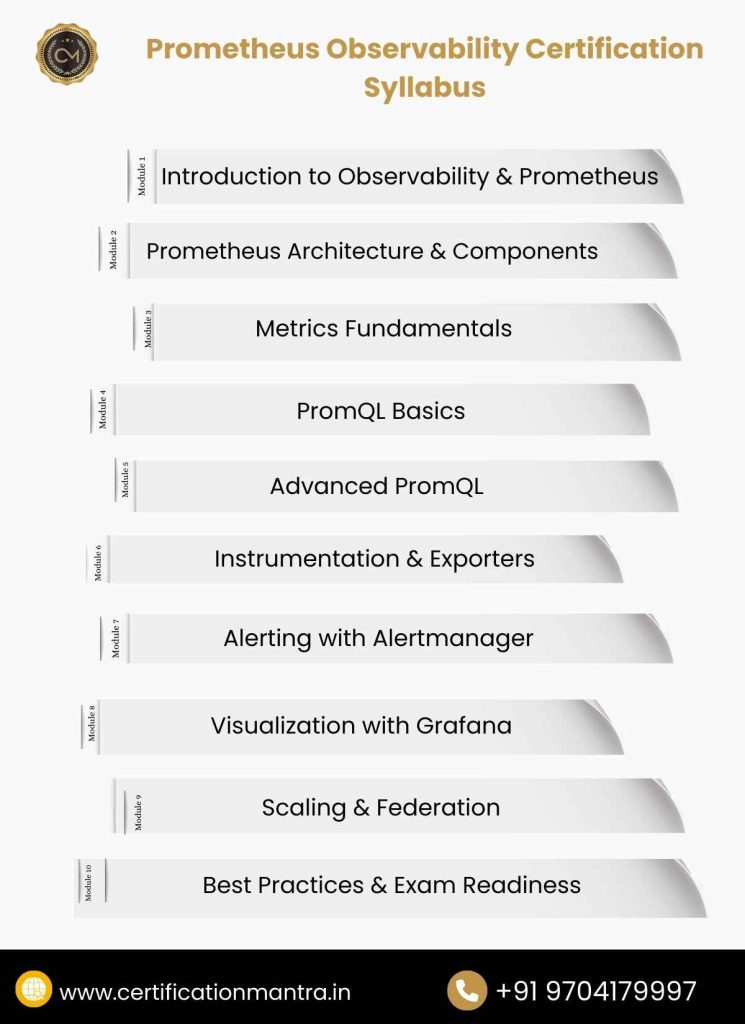
The Prometheus Observability Certification is structured into three levels, helping learners progress from fundamentals to advanced, real-world observability skills using Prometheus.


Frequently Asked Questions

- It validates skills in monitoring and observability using Prometheus.
The certification focuses on metrics, alerting, and visualization.
It is widely used in cloud-native environments.
DevOps engineers and SREs benefit the most.
Cloud engineers and system administrators can also apply.
Beginners can start with proper training.
Yes, Prometheus is an open-source monitoring tool.
It is widely adopted in Kubernetes ecosystems.
Many enterprises rely on it for observability.
Metrics collection and analysis are key skills.
PromQL and alerting knowledge is tested.
Real-world troubleshooting concepts are included.
Basic scripting knowledge is helpful.
PromQL is query-based, not full programming.
Hands-on practice makes it easier.
PromQL is Prometheus Query Language.
It is used to query time-series data.
It helps analyze metrics efficiently.
It is not mandatory but very useful.
Many Prometheus use cases involve Kubernetes.
Training covers Kubernetes-related examples.
Preparation time depends on experience level.
Beginners may take a few weeks.
Hands-on labs speed up learning.
Most providers offer online proctored exams.
Some may offer test-center options.
Check availability before booking.
Alertmanager manages alerts generated by Prometheus.
It reduces alert noise effectively.
It supports routing and grouping.
Yes, freshers can attempt it.
Basic DevOps knowledge is recommended.
Training helps build confidence.
Yes, it is widely accepted across industries.
Many companies value Prometheus skills.
It strengthens global job prospects.
- DevOps engineers commonly use Prometheus.
SREs rely on it for reliability monitoring.
Platform engineers also benefit.
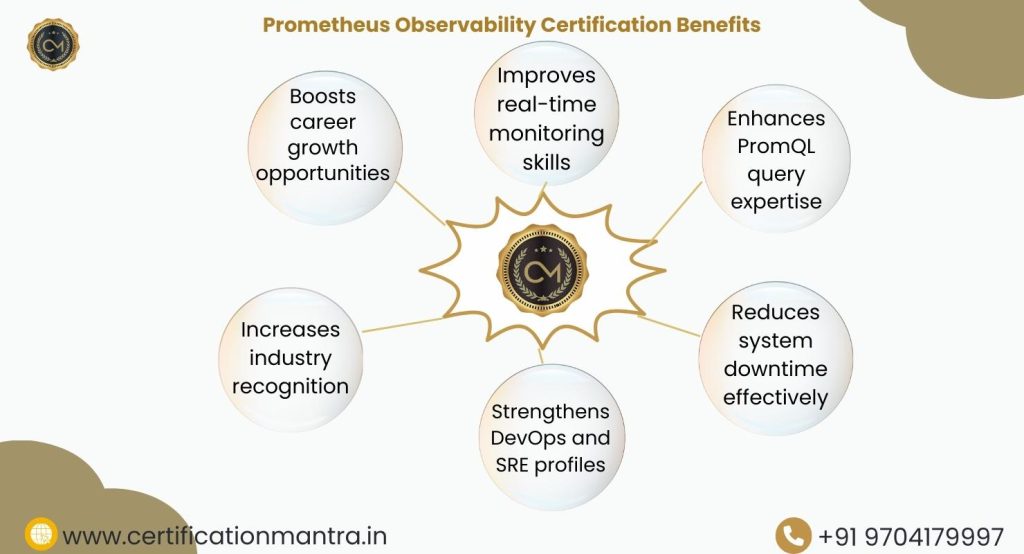
Yes, observability skills are in demand.
Certified professionals often earn more.
It adds value to your resume.
Yes, mock tests are recommended.
They help understand exam patterns.
Practice improves accuracy and speed.
IT and cloud services use it widely.
Fintech and SaaS companies rely on it.
Enterprises adopt it for monitoring.
Yes, visualization using Grafana is covered.
Dashboards improve monitoring clarity.
Grafana integrates well with Prometheus.
Difficulty depends on preparation.
Hands-on practice reduces complexity.
Concept clarity is the key.
Yes, retakes are usually allowed.
Waiting periods may apply.
Additional fees may be charged.
Training is not mandatory but recommended.
It helps understand exam expectations.
Structured learning improves success.
Alertmanager and Grafana are common tools.
Exporters play an important role.
Kubernetes enhances monitoring capabilities.
Some providers have validity periods.
Others offer lifetime certification.
Always check official guidelines.
- Observability helps understand system behavior.
It uses metrics, logs, and traces.
Prometheus focuses mainly on metrics.
Basic Linux knowledge is helpful.
Most servers run on Linux.
Commands assist in troubleshooting.
Yes, self-study is possible.
However, guided training is faster.
Practice labs improve understanding.
Yes, CertificationMantra offers expert guidance.
Support continues until exam completion.
Students get practical exposure.
Yes, it is widely used in production.
Large enterprises trust Prometheus.
It scales well with proper setup.
It proves real-world monitoring skills.
It aligns with industry standards.
It enhances professional credibility.
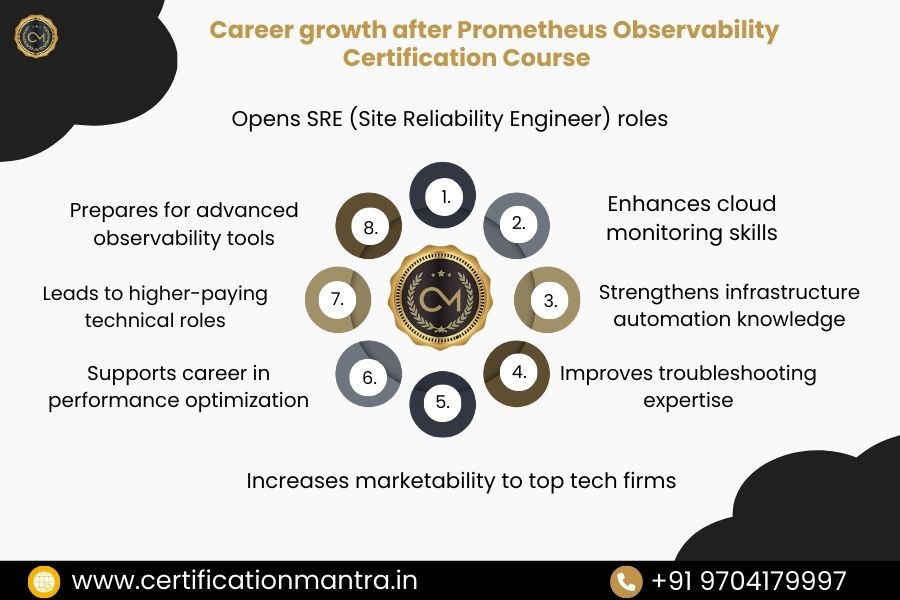
Yes, it supports DevOps career transitions.
It opens cloud and SRE opportunities.
Hands-on skills make switching easier.
It offers expert-led practical learning.
It aligns with real exam requirements.
It helps achieve certification confidently.